Brain network dynamics
An average connectivity map describes which brain regions tend to vary together over a recording. It leaves open a different question: how do recurring patterns combine and change as activity unfolds?
This project develops an interactive scientific workflow for that question. It revisits a dissertation-era spectral approach, implements a modular Python analysis, and relates its learned spatial patterns to contemporary cortical parcellations. The present analyses are a retrospective extension and demonstration, rather than a verified exact reproduction of the dissertation.
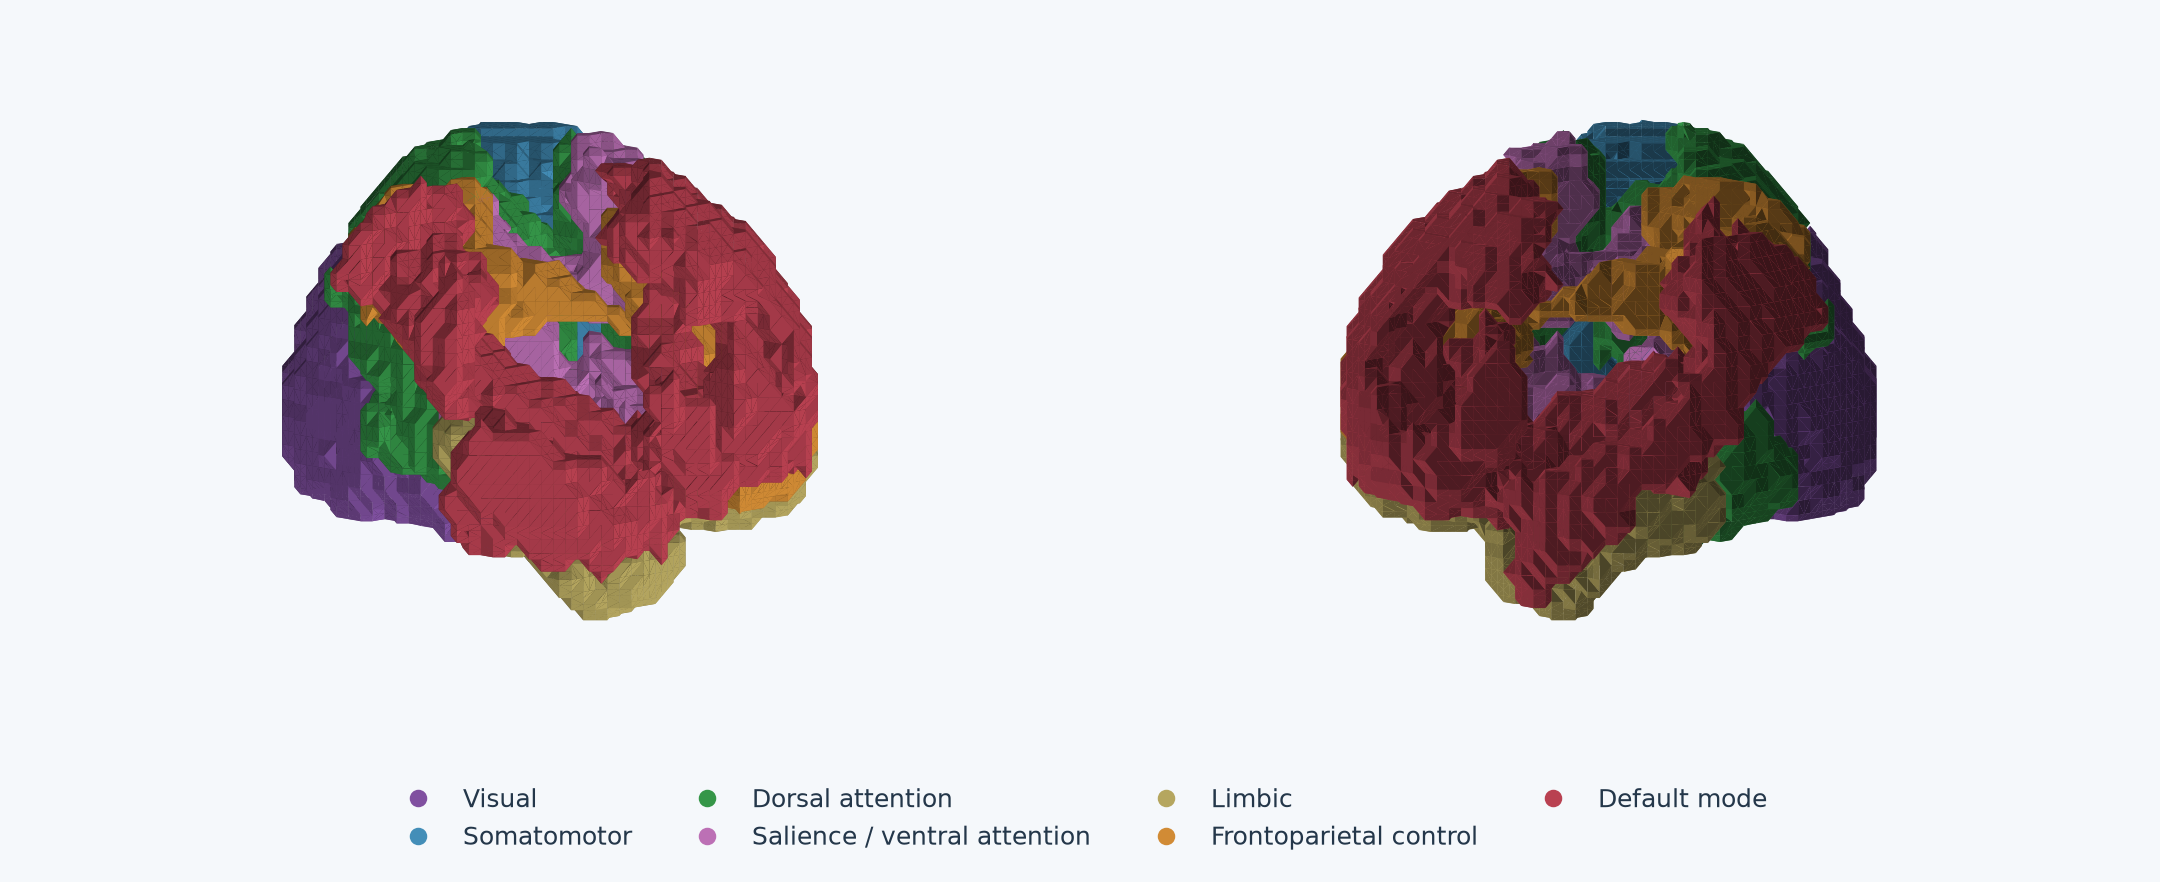
Reference systems supply anatomical context; their labels do not establish the cognitive function of a learned component.
From regional observations to predictive networks
Each cortical parcel supplies an fMRI time series. Spectral learning AI compresses relationships between recent and subsequent observations into a predictive representation. Spatial readouts describe patterns of ROI-pair weights, while time-varying coefficients describe their changing contributions.
Several networks can contribute at once. A pattern may have opposing signed poles associated with different functional systems; one coefficient scales both poles together. Reversing that coefficient reverses the pattern’s contribution, without independently identifying neural excitation or inhibition. These are fitted second-moment coefficients, not ordinary centered covariance matrices or probabilities of occupying discrete brain states.
The work combines reproducible signal preparation, modular model fitting, cohort summaries, functional-reference matching and linked browser-native figures. Notebooks and model computation stay in the research workspace; the interactive reports use precomputed results.
Three connected investigations
Visual task: expression during stimulation and fixation
The Studyforrest visual localizer contains 15 participants and four runs each. One model is trained across the 60 continuous runs; stimulus timing enters afterward. At measured block boundaries, Network 2’s average coefficient is higher during pooled stimulation than inter-block fixation in all 15 participants, and Network 7’s is lower. This is descriptive directional agreement within the fitted model, rather than a significance test or evidence that a fixed spatial matrix changes its anatomy.
Resting state–ASD: an exploratory comparison
A separate rank-12 fit uses 72 autistic NYU participants. Comparing corresponding matrix entries across all control–ASD network pairs finds strong spatial resemblance for several early components: Networks 2–5 have same-numbered matches with correlations of approximately 0.90–0.98. Other strong matches reverse orientation, and Networks 9 and 10 have different best-match numbering. The shared-basis distinction AI matters here: each cohort is trained independently, so correspondence must be evaluated rather than assumed.
The cohorts are not matched for age, sex or motion. These comparisons establish descriptive similarities between fitted summaries, not diagnostic effects or equality of temporal dynamics.
Reading the evidence
- Functional systems connects reference anatomy to learned positive and negative poles.
- Network matches separates spatial resemblance from the proportion of a pole’s weight concentrated in a system.
- Individual and temporal views expose the observations behind cohort summaries.
- Cohort comparison compares signed matrix patterns across or within the two resting-state fits.
The main interpretive limits are in-sample fitting, incomplete visual alignment and motion review, rank dependence and cohort differences. Independent prediction, repeated-fit stability and participant-level group comparisons remain future work. Parcels and functional systems AI describe different anatomical scales, and a reference match alone should not be treated as a validated functional label.
Data and methods sources
The resting recordings originate from ABIDE I and its Preprocessed Connectomes Project derivatives. The visual-task recordings originate from the Studyforrest visual localizer described by Sengupta and colleagues, 2016. The reports use Schaefer 100 cortical parcels and seven- or seventeen-system reference assignments; see the atlas documentation.
Study & Methods within each report describes the preparation, timing, cohort definition and quality checks. Dataset providers retain their applicable terms and attribution requirements.