Reading topic timelines in a balanced sample AI
The atlas contains 200,000 papers drawn with approximately equal allocations across 2010–2020. Its timelines describe how topics appear within that selected collection. They cannot directly measure the growth of scientific publishing as a whole.
The denominator comes from sampling
The pipeline reconciles duplicate records, requires a minimum abstract length, forms a uniform candidate reservoir within each year, and applies a strict English-abstract eligibility rule. The final selection is uniform among the retained eligible candidates, subject to the year allocation.
Equal allocations give older and newer years similar weight in the sample. They also remove the overall growth in publication volume that an unrestricted annual count might contain. An increase from 100 to 200 sampled papers in a topic suggests a larger share of this year’s sampled frame, provided coverage and eligibility remain comparable. It does not establish that the field doubled its output.
The source collection’s journal coverage, missing abstracts and language exclusions all shape that frame. Balancing years cannot fill an absent journal or recover a topic that was never collected.
Counts and normalized histories answer different questions
The default stacked area chart uses paper counts. Its component branches sum to the selected parent when all are visible. Hiding a legend entry removes that branch from the visible stack; the smaller displayed total does not change the stored membership.
The normalization option scales each topic by its own maximum annual count:
A topic with counts 10, 20 and 40 becomes 25, 50 and 100. Counts 100, 200 and 400 produce the same normalized history. This helps compare shapes while deliberately discarding differences in volume.
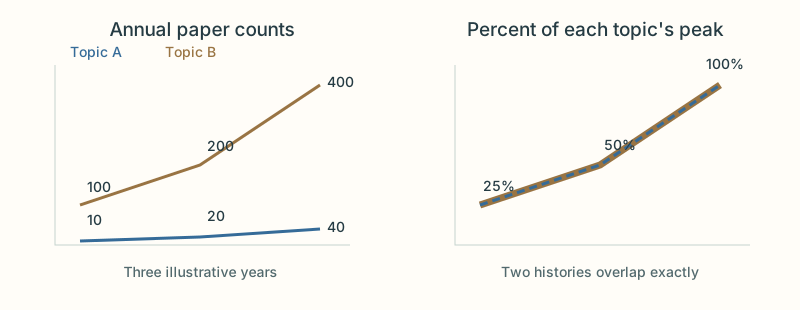
Illustrative numbers, not observations from the atlas. The normalized stack no longer sums to a paper count or a share of a year.
A useful exploratory reading
Look for a rise, select the branch, and inspect papers from the relevant years. A possible change in subject matter is a question to investigate, rather than a measured historical conclusion. The tree is fitted across all years together; these are histories of fixed memberships, not separately discovered topics tracked as they split or merge over time.