From scientific abstracts to a topic map AI
An embedding represents a paper as a vector: a list of numbers that makes it possible to compare documents computationally. In this atlas, that representation supplies the starting point for both topic grouping and the maps. The grouping and the display then follow separate paths.
Two reductions serve different purposes
The atlas uses SPECTER2 to encode titles and abstracts as 768-dimensional vectors. SPECTER2 was developed for scientific document representations. The atlas applies the pretrained model to its paper collection.
Normalized vectors pass through principal component analysis, retaining 128 dimensions. PCA is a linear projection onto directions of decreasing variance. Here it is unwhitened, and the resulting scores are not normalized again before Ward clustering. This preserves the relative variance of the retained components. See the PCA documentation for the distinction between projection and whitening.
A separate five-dimensional UMAP fit starts from the original embeddings. The viewer displays its first two or three coordinates. These coordinates make a browsable arrangement; they do not determine which papers belong to a Ward branch.
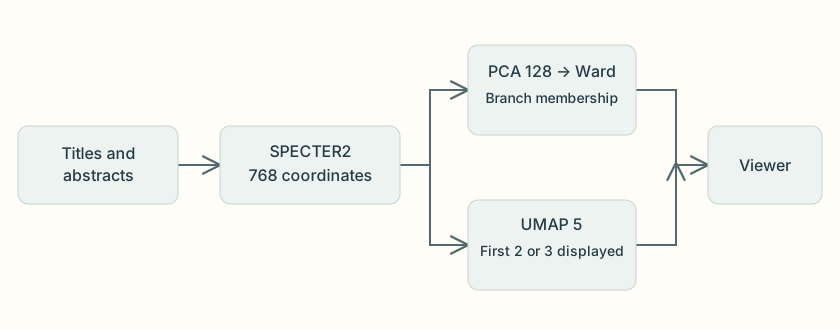
PCA supplies the representation for grouping papers; UMAP supplies coordinates for displaying them.
Reading proximity carefully
Nearby papers are candidates for related reading. Their position is still a compressed view of the model’s representation. UMAP can change density and separation, as its authors explain. Reading only the first coordinates of a five-dimensional fit introduces further loss of information.
Consequently, a broad branch may appear in several patches, while different branches may overlap on screen. The topic-spacing controls move those patches for navigation; displayed distances after spacing are even less suitable as measurements of similarity.
To judge a topic, inspect its member papers alongside the map. A visual gap alone does not establish a disciplinary boundary.
For how membership is defined, see Ward topic hierarchies.