Second moments, covariance, and connectivity AI
A matrix relating regional signals is not automatically a correlation matrix. Its interpretation depends on whether the signals have been centered, how they have been scaled, and which product is being estimated. These choices matter when a dynamical model produces signed spatial patterns from positive-valued inputs.
Means contribute to a second moment
For an ROI signal vector , define its mean . The second-moment matrix is , while covariance is
Covariance describes variation around the mean. Correlation further divides each covariance by the two regional standard deviations. This removes their units and yields a measure of linear association; Nilearn’s connectivity tools distinguish these estimators.
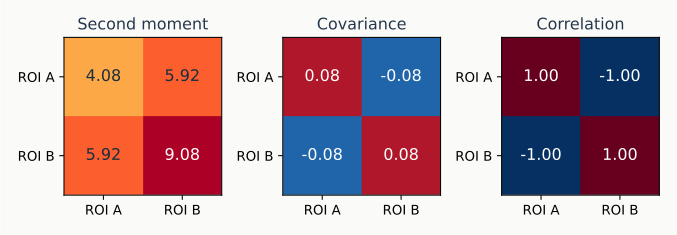
Illustrative signals with positive means and exactly opposing fluctuations. Their off-diagonal second moment is positive even though their correlation is −1.
A predictive moment is conditional
A temporal model may estimate from a recent history . Its corresponding conditional covariance would require subtracting , using the conditional mean. Subtracting one whole-recording mean is not generally equivalent.
In the spectral model, is represented by a constant matrix and a weighted sum of network coefficient matrices. Individual coefficient matrices need not be positive semidefinite or interpretable as valid covariances. Finite fitted estimates of the combined moment can also violate positive semidefiniteness; the statistical target does not guarantee that every numerical estimate satisfies its constraints.
What signed patterns can tell us
Min–max scaling retains nonzero regional means. Mean structure can therefore occupy substantial space in the modeled moments, helping explain why an early component can look broadly mean-like. Negative entries in one coefficient pattern describe its contribution to the expansion; they do not by themselves establish anticorrelated BOLD signals or inhibitory connections.
For functional interpretation, first identify the modeled quantity. A spatial resemblance to a familiar system can help name a pattern’s anatomy without turning that pattern into conventional functional connectivity.