From fMRI signals to network graphs AI
A brain-network graph is a representation built from measurements and assumptions. Nodes might be cortical parcels, individual voxels or components estimated from the data. Edges might encode temporal correlation, conditional association or a fitted model coefficient. A drawing can look similar under these choices while answering very different questions.
Construct the graph before interpreting it
A typical ROI workflow prepares regional time series, estimates a relationship for each pair, and stores those values in an adjacency matrix. Correlation produces a symmetric, undirected graph. A directed model requires a defined directional estimator; adding arrows to correlations does not supply one.
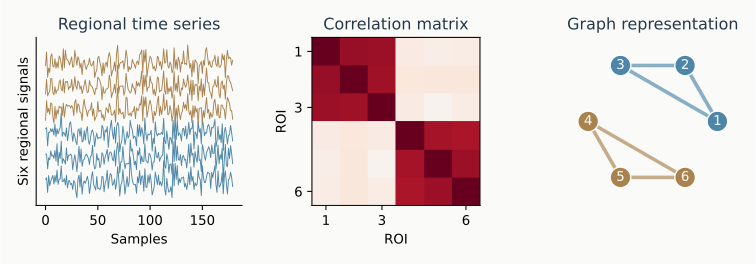
Illustrative regional signals and graph. Node layout helps reading; spatial proximity in the drawing does not establish a biological relationship.
Networks can also be identified without starting from all pairwise edges. Independent component analysis estimates spatial components with associated time courses. Clustering can group similar regional profiles, and community detection can partition a previously constructed graph. Smith and colleagues’ comparison of activation and resting architecture illustrates an ICA-based approach to distributed systems. These are related strategies, not interchangeable definitions of a network.
Graph measures summarize the chosen edges
Degree counts retained neighbors; strength sums their weights. A local clustering coefficient describes connections among a node’s neighbors. Centrality measures describe different kinds of graph prominence, while modularity evaluates a proposed community organization. Their meaning follows the edge definition and any weighting or thresholding conventions, as discussed by Rubinov and Sporns.
Signed weights need explicit treatment: positive strength and negative magnitude can be summarized separately instead of cancelling. Likewise, interpreting large weights as short paths requires a justified conversion from relationship strength to distance. A graph-theoretic path is not automatically a route taken by neural signals.
A graph is not its picture
Thresholding changes graph density and can change degree, communities and apparent hubs. Showing only strong edges for readability is different from removing them before analysis. Comparisons should state which operation occurred and how sensitivity to density was assessed.
In the predictive-dynamics analysis, each learned network is a signed coefficient matrix that can be drawn as a graph. Its edges contribute to a moment model; they are not newly measured Pearson connections. The graph vocabulary helps inspect those patterns while preserving that distinction.